
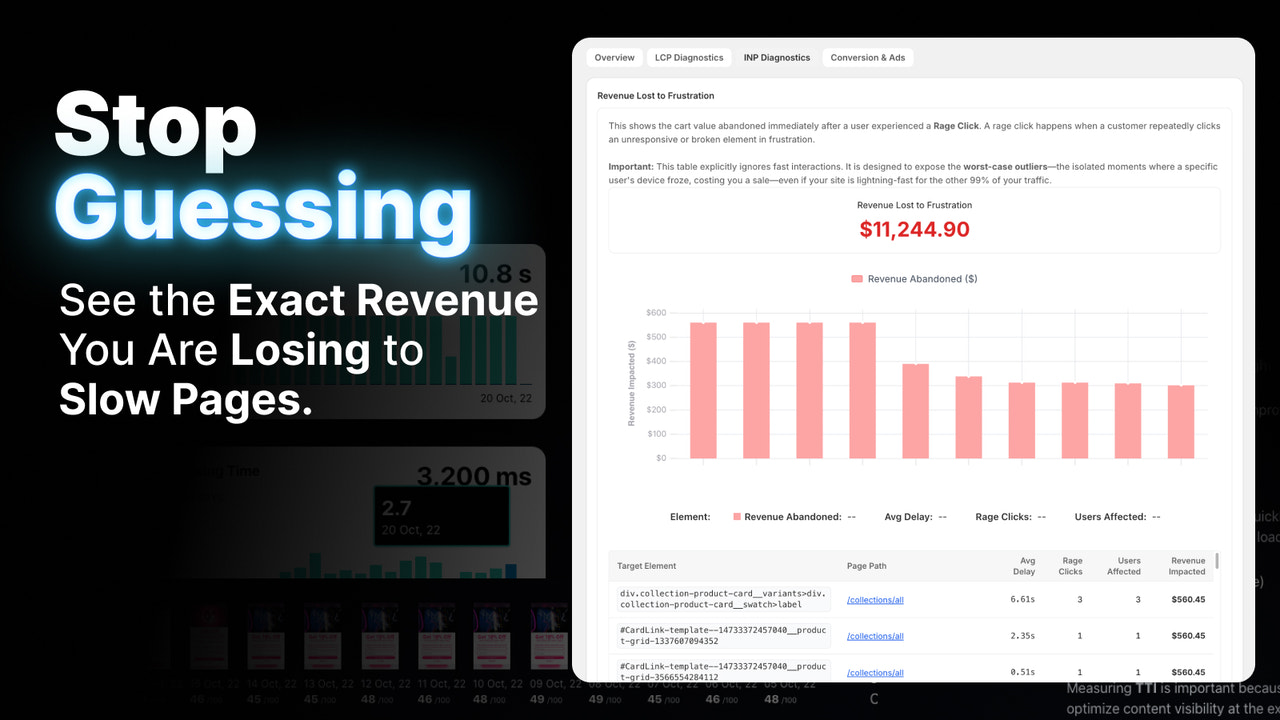
The official Superspeed illustration shows how performance issues are reported. The displayed revenue figures are vendor examples, not our measured losses.
“The store feels slow” is a useful warning, but a weak work ticket. Which page, on which device, and during which interaction? A product page that loads slowly and a checkout path that never begins require different investigations.
Superspeed: Conversion & Speed combines real-visitor performance information with conversion-friction signals and optimization tools. Its central value is helping merchants connect a reported problem to a specific part of the shopping journey rather than treating one store-wide score as the whole diagnosis.
This article is part of a reciprocal content collaboration with the Superspeed team. It describes the platform's published capabilities; no revenue-loss calculation or speed test in this article represents our own measurement.
Start with the affected journey
The official site describes segmenting performance by page, device and traffic source. Those distinctions help make a problem actionable. A store-wide average can conceal a difficult ad landing page or a mobile interaction that desktop visitors do not experience.
Choose a question narrow enough to investigate. “Do shoppers wait after landing on this product page?” is more useful than “Is the whole site bad?” It identifies a page and an experience to inspect without presuming the cause.
Swipe horizontally to read the full table.
| Signal | Question it helps investigate | What it does not prove by itself |
|---|---|---|
| Slow page experience | Where does loading or interaction feel delayed? | That one specific app caused the delay |
| Repeated clicks | Is an element responding as the shopper expects? | The visitor's exact intent or frustration |
| Checkout-path signal | Where does the recorded purchase journey stop? | The reason for every abandoned purchase |
| Broken link | Which destination produces a dead end? | That every affected visit would have converted |
The table is an editorial interpretation framework, not a list of measurements taken on a merchant's store.
Performance metrics need context
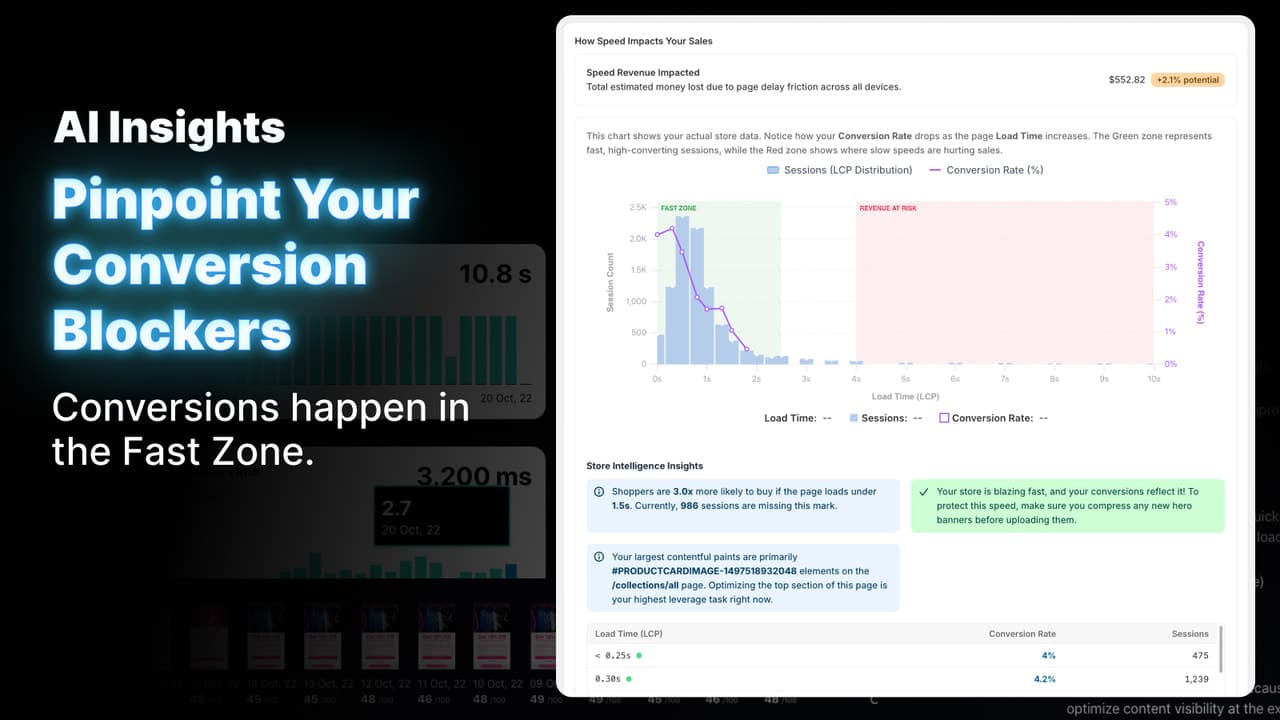
The report groups visits by loading experience. Figures are vendor examples, not our results.
Superspeed publishes Core Web Vitals diagnostics and optimization features. Read a metric beside the page and segment it describes. Loading, layout movement and interaction response concern different parts of the experience; a better value in one does not establish that the whole journey is fixed.
The useful next step is to connect the signal to an observable page problem. Review important images, scripts and layout behavior in the affected experience. Give the person making changes a concrete description instead of forwarding a dashboard number without context.
Keep the reporting period visible when comparing results. A different mix of devices or campaign traffic can change an aggregate view. This is general analysis guidance, not a claim about an undocumented Superspeed sampling method.
Rage clicks and ghost checkouts are investigation prompts
The product materials describe rage clicks as repeated clicking and associate ghost checkouts with script freezes that block payment. The latter is a technical-friction signal, not a synonym for ordinary checkout abandonment. A shopper who decides not to buy is a different case from someone whose purchase action stops responding.
If a button receives repeated clicks, inspect its response and the next destination. If a checkout signal indicates a gap, compare it with the store's purchase path. A visitor might stop for several reasons; an event label is not a recording of their thoughts.
Use these signals to identify the page and interaction needing investigation. Superspeed's public summary does not establish every event threshold or a reproducible rate calculation, so confirm those details before comparing an internal target with its report. A signal points to work to inspect; it does not prove how much revenue a fix will recover.
Social in-app browsers deserve their own review
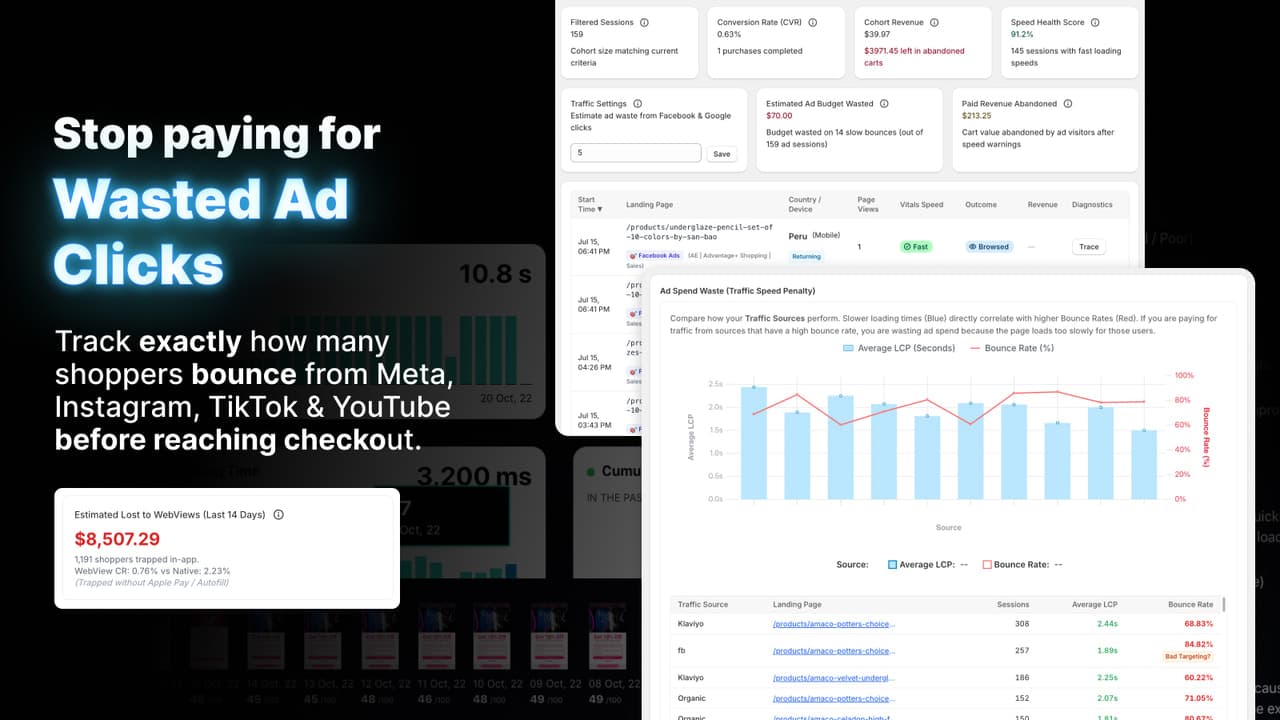
Review the source and browsing environment together. Illustrated revenue figures are not your store's measured losses.
Superspeed has a social-browser feature for traffic arriving inside social apps. That matters because an ad click can open a shopping journey in a different browser context from a normal Safari or Chrome visit.
The feature is presented as a way to move supported shoppers into a native browser. Confirm its current behavior on the platforms and devices that supply your traffic. Do not assume every Instagram, TikTok or Facebook visit behaves identically or that a browser change guarantees payment completion.
Review the transition as a shopper: does the intended product remain easy to reach, and is the next step understandable? A feature aimed at reducing friction still needs to fit the actual campaign journey.
From an action plan to a controlled change
Match the finding to the next investigation
Loading or interaction delay
Open the affected page and device segment. The site describes Core Web Vitals diagnostics by page and segment; use that context rather than assigning one store-wide cause.
Repeated or ineffective clicks
Inspect the journey and element involved. A click pattern points to an interaction worth reproducing, not a guaranteed explanation of the visitor's intent.
Social-browser friction
Review the actual Instagram or TikTok journey, including the buying path. The product describes native-browser jump pages; confirm the configured behavior rather than promising every session will move successfully.
Dead destination
Identify the broken link and choose a relevant replacement. Broken-link catching and recovery are described features, but redirecting someone does not prove a recovered sale.
The listing describes action plans and speed templates. Use them as a connection between the diagnosed issue and the work to be done—not as a promise that every storefront problem is automatically removed.
Make a diagnostic useful to the team
Locate the problem
Identify the page, device or traffic segment associated with the signal. Keep the question specific enough to reproduce or inspect.
Choose the change
Review the relevant product guidance and decide who owns the affected theme, app or page. Avoid giving several tools the same optimization responsibility.
Check the shopping path
After the change, review browsing, product selection and cart entry in the affected context. Compare the reporting period without treating a small fluctuation as proof of recovered revenue.
These are recommended operating steps, not a button-by-button Superspeed tutorial. Exact application and rollback behavior should come from the current product documentation.
Revenue-impact figures are not banked profit
Superspeed markets revenue-impact analysis. A dashboard estimate can help prioritize a problem, but a modeled loss is not a transaction that definitely would have occurred. Likewise, an attributed recovery figure is not automatically incremental profit.
Separate observed events from estimated commercial impact. Ask what assumptions produce the dollar figure, what time window it covers and how it handles changes in traffic. This guide does not reproduce a revenue-loss equation because no fully verified method has been established here.
The same caution applies to vendor case-study headlines. A result reported by a named customer belongs to that case and context. It should not become a universal promise or an invented example in an article about another store.
Plans use monthly page views
The Shopify listing, checked October 7, 2026, shows these monthly prices and page-view capacities.
Swipe horizontally to read the full table.
| Plan | Monthly price | Monthly page views |
|---|---|---|
| Lite | $29 | Up to 200,000 |
| Growth | $49 | Up to 1 million |
| Pro | $99 | Up to 3 million |
| Business | $249 | Up to 10 million |
All four show a 14-day trial. Higher plans also list different reporting windows and support capabilities. Use the current plan page for the exact scope you need.
The website uses “sessions” in some plan summaries while the listing uses page views. These are different units, so confirm the billing definition rather than substituting one for the other. Traffic capacity should be understood before the subscription becomes part of an operating budget.
Frequently asked questions
Is Superspeed just a page-speed score?
Its published scope includes visitor and conversion-friction diagnostics alongside performance and optimization features. Read the signals by page and journey, not as one overall verdict.
Does a rage click prove why a shopper left?
No. It is a recorded behavior to investigate. Review the affected interaction before inferring cause.
Are revenue-loss numbers guaranteed recoverable sales?
No guarantee is made here. Clarify the platform's estimate and attribution method, and distinguish modeled impact from observed transactions and profit.
Should I budget using sessions or page views?
The current Shopify listing uses monthly page views. Confirm that unit with the vendor because some website summaries use different wording.
Visit Superspeed and its Shopify listing to review current capabilities. The strongest use of the platform is turning a vague performance concern into a clearer investigation and a deliberate change.